Note
Go to the end to download the full example code.
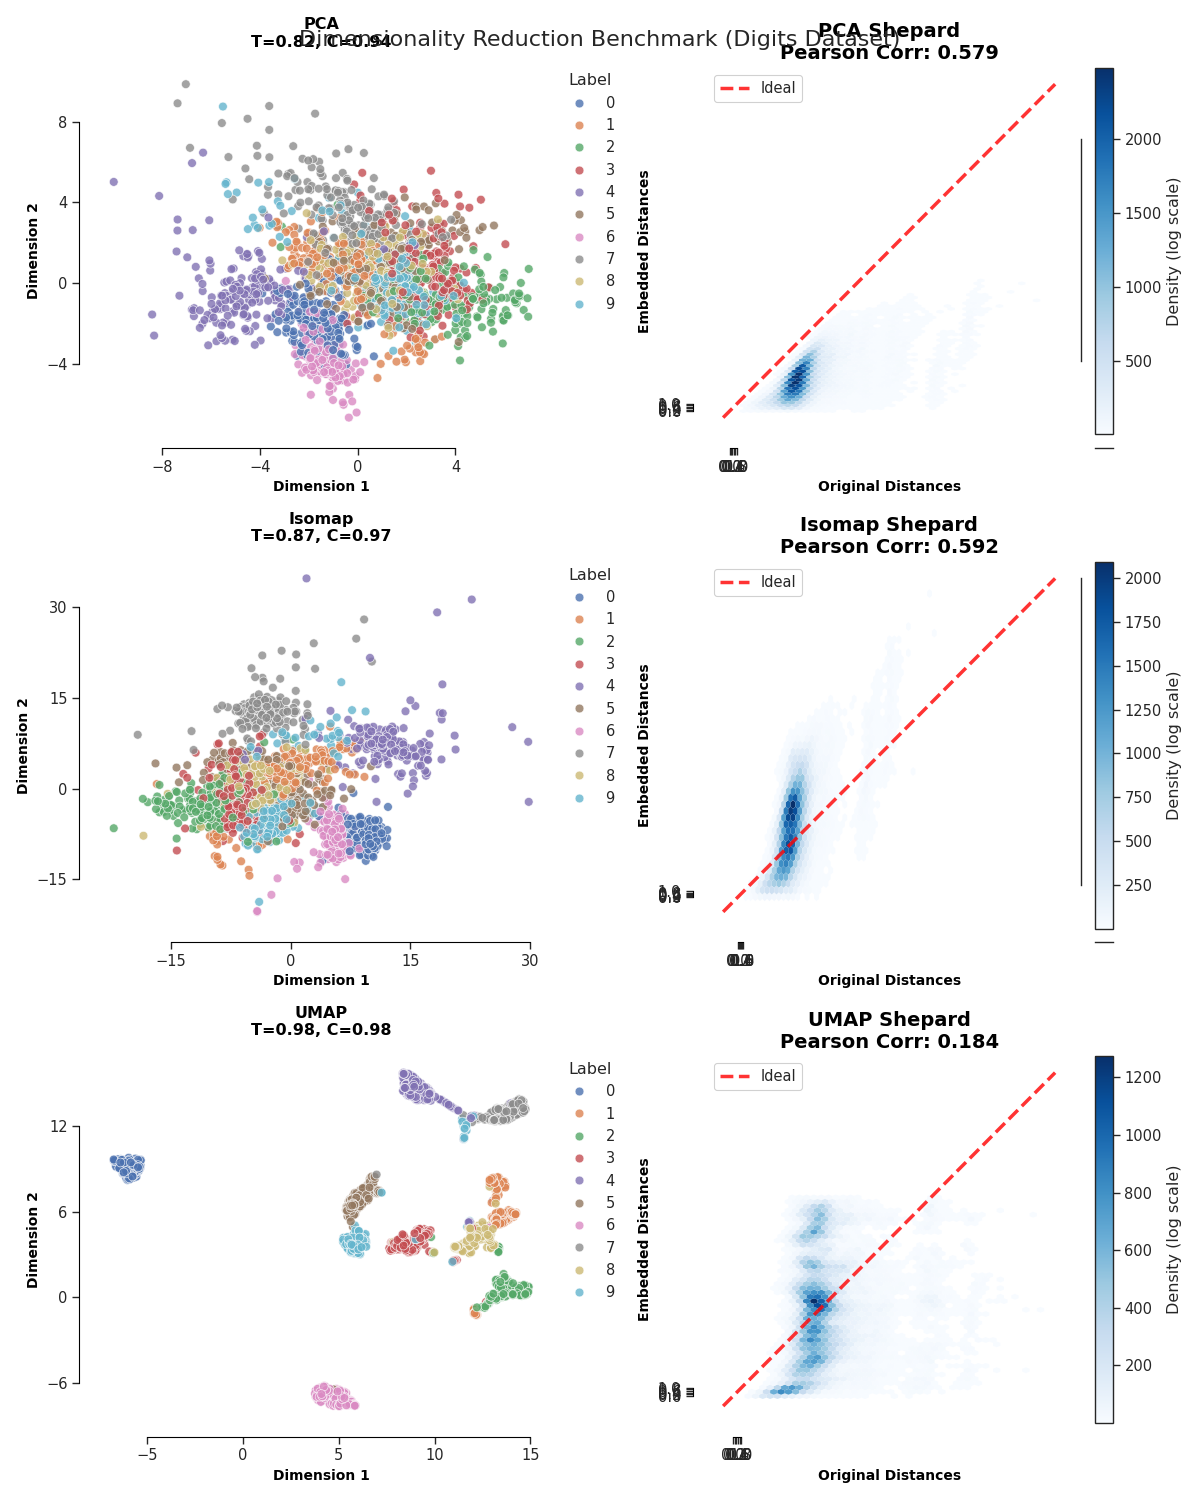
Benchmark Dimensionality Reduction Methods
This script demonstrates how to use the enhanced coco_pipe.dim_reduction module to benchmark different dimensionality reduction techniques on the Digits dataset.
It compares PCA, UMAP, and Isomap using: 1. Visualization (2D Embeddings). 2. Quantitative Metrics (Trustworthiness, Continuity, LCMC). 3. Shepard Diagrams.
Loading Digits dataset...

Running PCA...
  Trustworthiness: 0.8168
  Continuity:      0.9424
  LCMC:            0.1278

Running Isomap...
  Trustworthiness: 0.8678
  Continuity:      0.9651
  LCMC:            0.1885

Running UMAP...
  Trustworthiness: 0.9762
  Continuity:      0.9795
  LCMC:            0.4850

Benchmark complete. Results plot saved to benchmark_results.png
import matplotlib.pyplot as plt
from sklearn.datasets import load_digits
from sklearn.preprocessing import StandardScaler

from coco_pipe.dim_reduction import DimReduction
from coco_pipe.dim_reduction.evaluation.metrics import (
    compute_coranking_matrix,
    continuity,
    lcmc,
    trustworthiness,
)
from coco_pipe.viz.dim_reduction import plot_embedding, plot_shepard_diagram


def main():
    # 1. Load Data
    print("Loading Digits dataset...")
    digits = load_digits()
    X = StandardScaler().fit_transform(digits.data)
    y = digits.target

    # 2. Define Methods to Benchmark
    methods = [
        ("PCA", {"n_components": 2}),
        ("Isomap", {"n_components": 2, "n_neighbors": 30}),
        ("UMAP", {"n_components": 2, "n_neighbors": 15, "min_dist": 0.1}),
    ]

    # 3. Run Benchmark
    results = {}

    fig, axes = plt.subplots(len(methods), 2, figsize=(12, 5 * len(methods)))
    plt.subplots_adjust(hspace=0.4, wspace=0.3)

    for i, (name, kwargs) in enumerate(methods):
        print(f"\nRunning {name}...")

        # Initialize and Fit
        reducer = DimReduction(method=name, **kwargs)
        X_emb = reducer.fit_transform(X)

        # Compute Metrics
        Q = compute_coranking_matrix(X, X_emb)
        t_score = trustworthiness(Q, k=12)
        c_score = continuity(Q, k=12)
        l_score = lcmc(Q, k=12)

        print(f"  Trustworthiness: {t_score:.4f}")
        print(f"  Continuity:      {c_score:.4f}")
        print(f"  LCMC:            {l_score:.4f}")

        results[name] = {"T": t_score, "C": c_score, "L": l_score}

        # Plot Embedding
        ax_emb = axes[i, 0] if len(methods) > 1 else axes[0]
        plot_embedding(
            X_emb,
            labels=y,
            title=f"{name}\nT={t_score:.2f}, C={c_score:.2f}",
            ax=ax_emb,
        )

        # Plot Shepard Diagram
        ax_shep = axes[i, 1] if len(methods) > 1 else axes[1]
        plot_shepard_diagram(
            X, X_emb, sample_size=500, title=f"{name} Shepard", ax=ax_shep
        )

    plt.suptitle("Dimensionality Reduction Benchmark (Digits Dataset)", fontsize=16)

    save_path = "benchmark_results.png"
    plt.savefig(save_path, dpi=150, bbox_inches="tight")
    print(f"\nBenchmark complete. Results plot saved to {save_path}")


if __name__ == "__main__":
    main()
Total running time of the script: (0 minutes 7.855 seconds)